 Outdoor Stats
California Lost 92% of Its Pheasant Harvest in 25 Years
California used to be pheasant country. In the late 1990s, hunters pulled nearly 5,000 birds a season from 16 state wildlife areas. Today it's under 400 — and the decline isn't slowing down.
The decline is exponential — and predictable
This isn't a sudden crash. It's a smooth, steady exponential decay. An exponential model fits the 26-year harvest data with an R² of 0.91 — meaning the curve explains over 90% of the variation.
The harvest drops roughly 8.8% per year, with a half-life of about 8 years. Every 8 years, half the remaining pheasants disappear from the harvest totals.
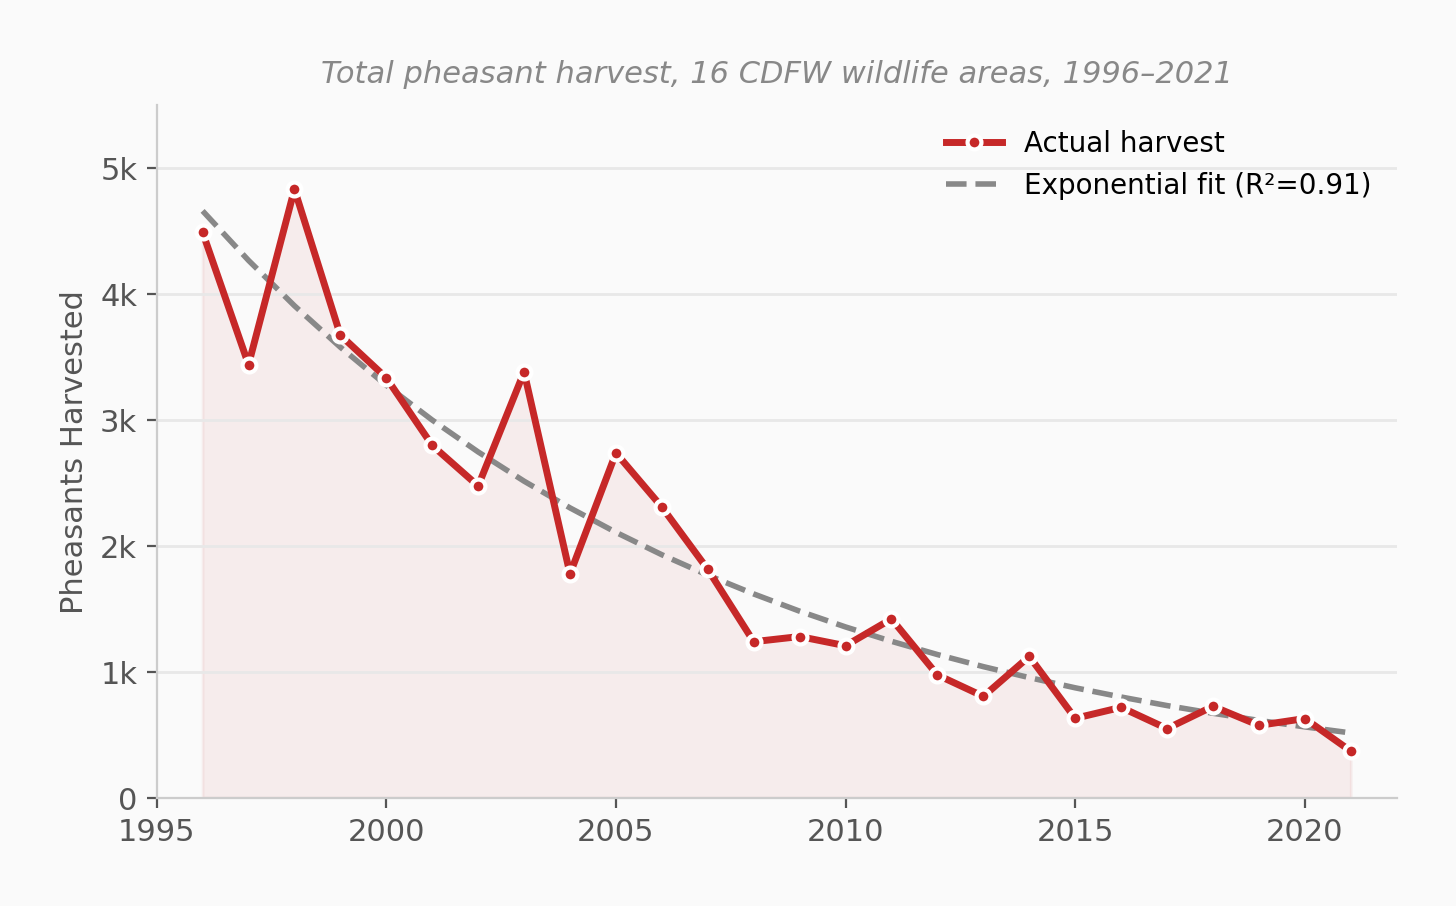
There's no inflection point, no single bad year that broke the population. The residuals bounce randomly around the trendline. This is a system in long-term structural decline — driven by habitat loss as the Central Valley converted grain fields and idle land to orchards, vineyards, and rice.
Both basins collapsed at the same rate
Sacramento Valley produced the vast majority of California's pheasant harvest — it peaked at 4,281 birds in 1998. San Joaquin Valley peaked later at 809 birds in 2006. But when you normalize both to their 1996 baseline, they track almost identically: Sacramento Valley is at 8% of its 1996 level, San Joaquin Valley at 11%.
This isn't a story about one region's bad luck. The collapse is valley-wide, which points to systemic causes — habitat conversion, changes in farming practices — rather than localized problems.
Where the birds were — and where they are now
Gray Lodge once dominated California pheasant hunting. Over 26 seasons it produced 13,327 birds — more than double any other area. But Gray Lodge's harvest dropped 97%, from an average of 1,374 per year in the late 1990s to just 39 per year recently.
The ranking reshuffled dramatically. Yolo jumped 15 spots from last place to first. Gadwall and Colusa fell hard. Here's how every area compares:
| Area | All-Time Total | 2017–21 Total | Rank Shift |
|---|---|---|---|
| Yolo | 4,710 | 1,289 | ▲ 15 |
| Gray Lodge | 13,327 | 195 | ▲ 2 |
| China Island | 1,920 | 243 | ▼ 1 |
| Los Banos | 1,913 | 147 | ▲ 5 |
| Little Dry Creek | 6,063 | 136 | ▲ 2 |
| Llano Seco | 1,330 | 129 | ▲ 2 |
| Salt Slough | 1,740 | 123 | ▲ 5 |
| Delevan | 4,258 | 116 | ▼ 5 |
| Colusa | 3,213 | 99 | ▼ 7 |
| Howard Slough | 3,295 | 88 | ▼ 4 |
| San Luis | 571 | 80 | ▲ 2 |
| Sacramento | 3,409 | 74 | ▼ 1 |
| Mendota | 2,547 | 53 | ▼ 3 |
| Sutter | 583 | 32 | — |
| Gadwall | 159 | 27 | ▼ 11 |
| Volta | 205 | 9 | ▼ 1 |
Yolo's jump is misleading — more on that below. The real story is how uniformly the once-dominant Sacramento Valley refuges fell. Gray Lodge, Delevan, Colusa, Howard Slough, and Sacramento all once averaged 200–1,300+ birds a year. Now they're in the teens and twenties.
15 of 16 areas declined
Every wildlife area except Yolo saw its harvest collapse. Eight areas lost 90% or more. Even the "best" performer among the decliners — Gadwall — still dropped 13%.
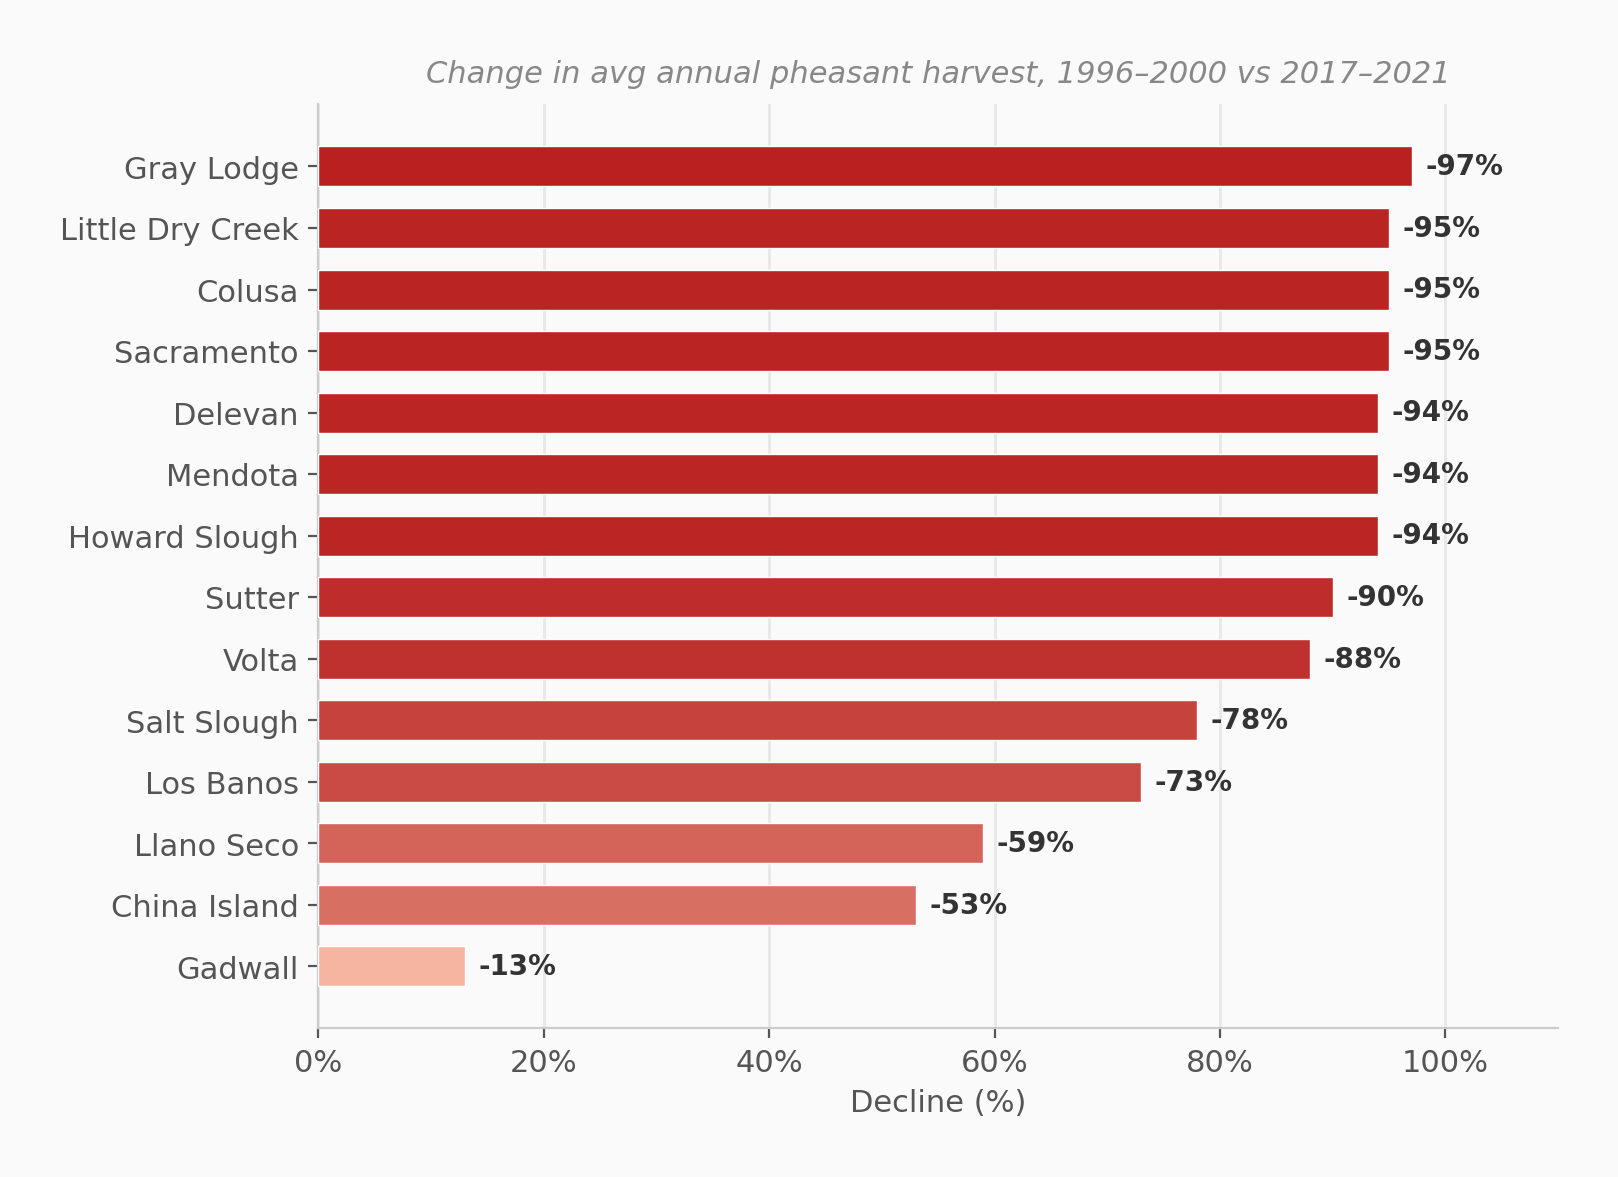
Sacramento Valley areas were hit hardest. Gray Lodge, Little Dry Creek, Colusa, Sacramento, and Delevan all lost 94–97% of their harvest. San Joaquin Valley fared slightly better in percentage terms, but started from lower numbers.
It's not just fewer hunters
The raw harvest decline could reflect fewer hunters showing up, not necessarily fewer birds. To test that, we used waterfowl check-station data — the only per-area hunter counts available — filtered to November and December to overlap with pheasant season.
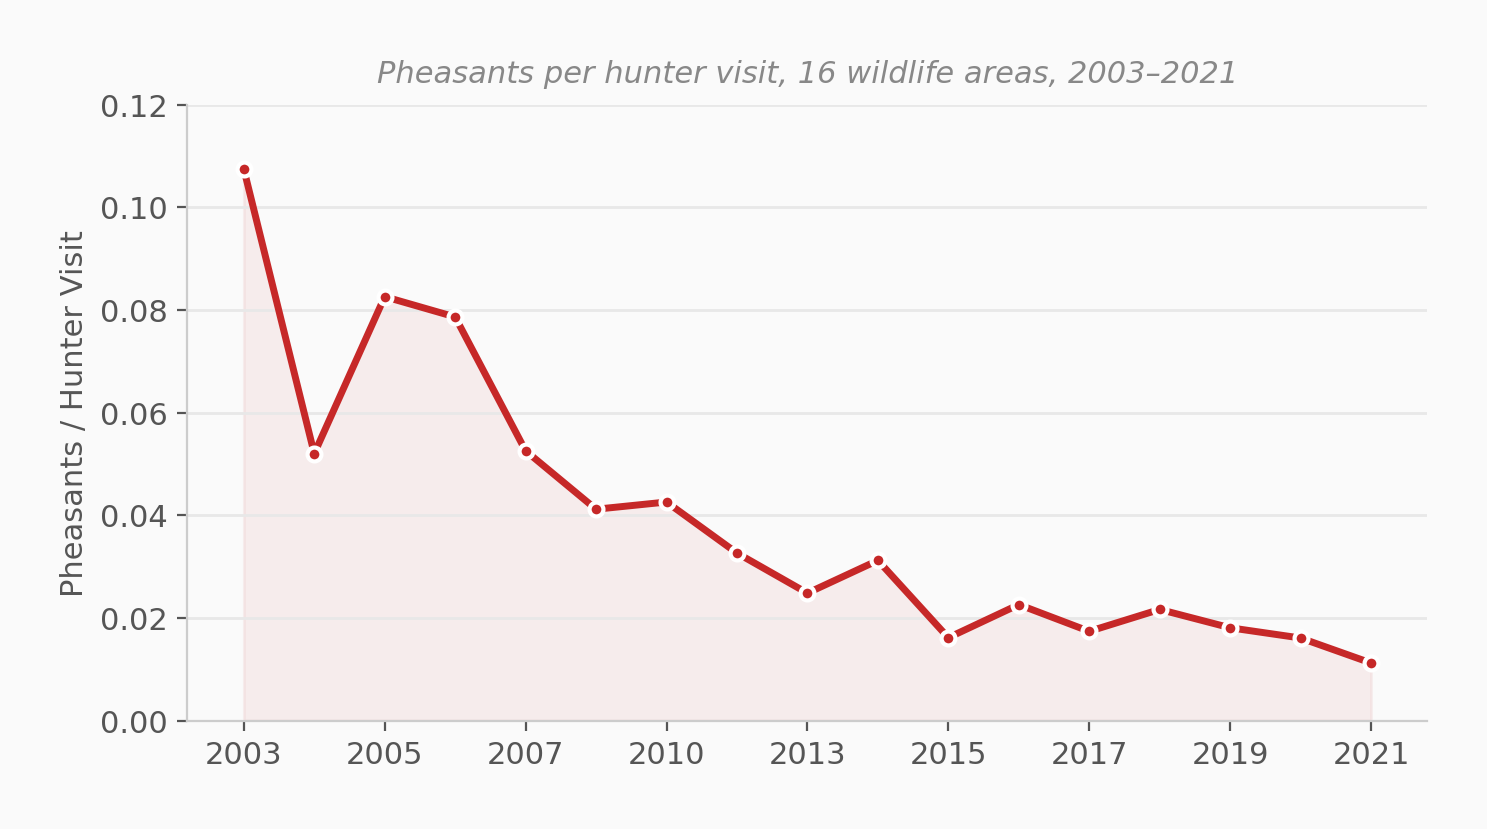
The first thing that stands out: hunter traffic barely changed. Nov–Dec hunter visits at the 16 pheasant areas held between 28,000 and 39,000 per year from 2003 to 2021. Meanwhile, the pheasant harvest cratered.
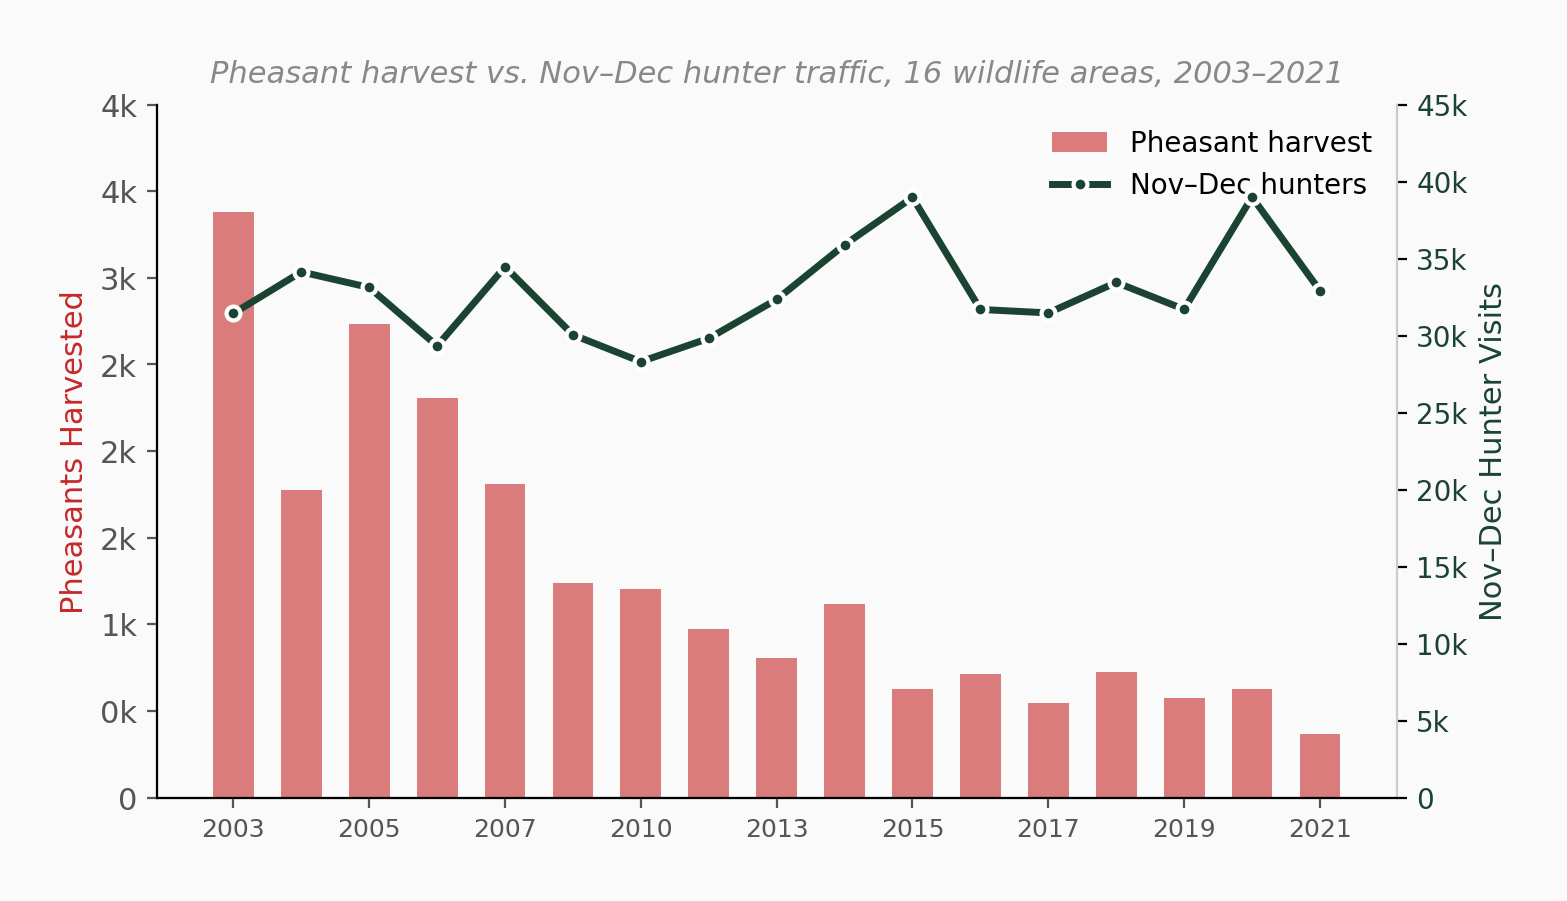
That divergence between flat hunter traffic and collapsing harvest shows up clearly in the per-hunter rate. Each hunter is finding dramatically fewer pheasants — not just fewer hunters are going.
The per-hunter decline varied by area, but the result is the same everywhere: the birds are harder to find.
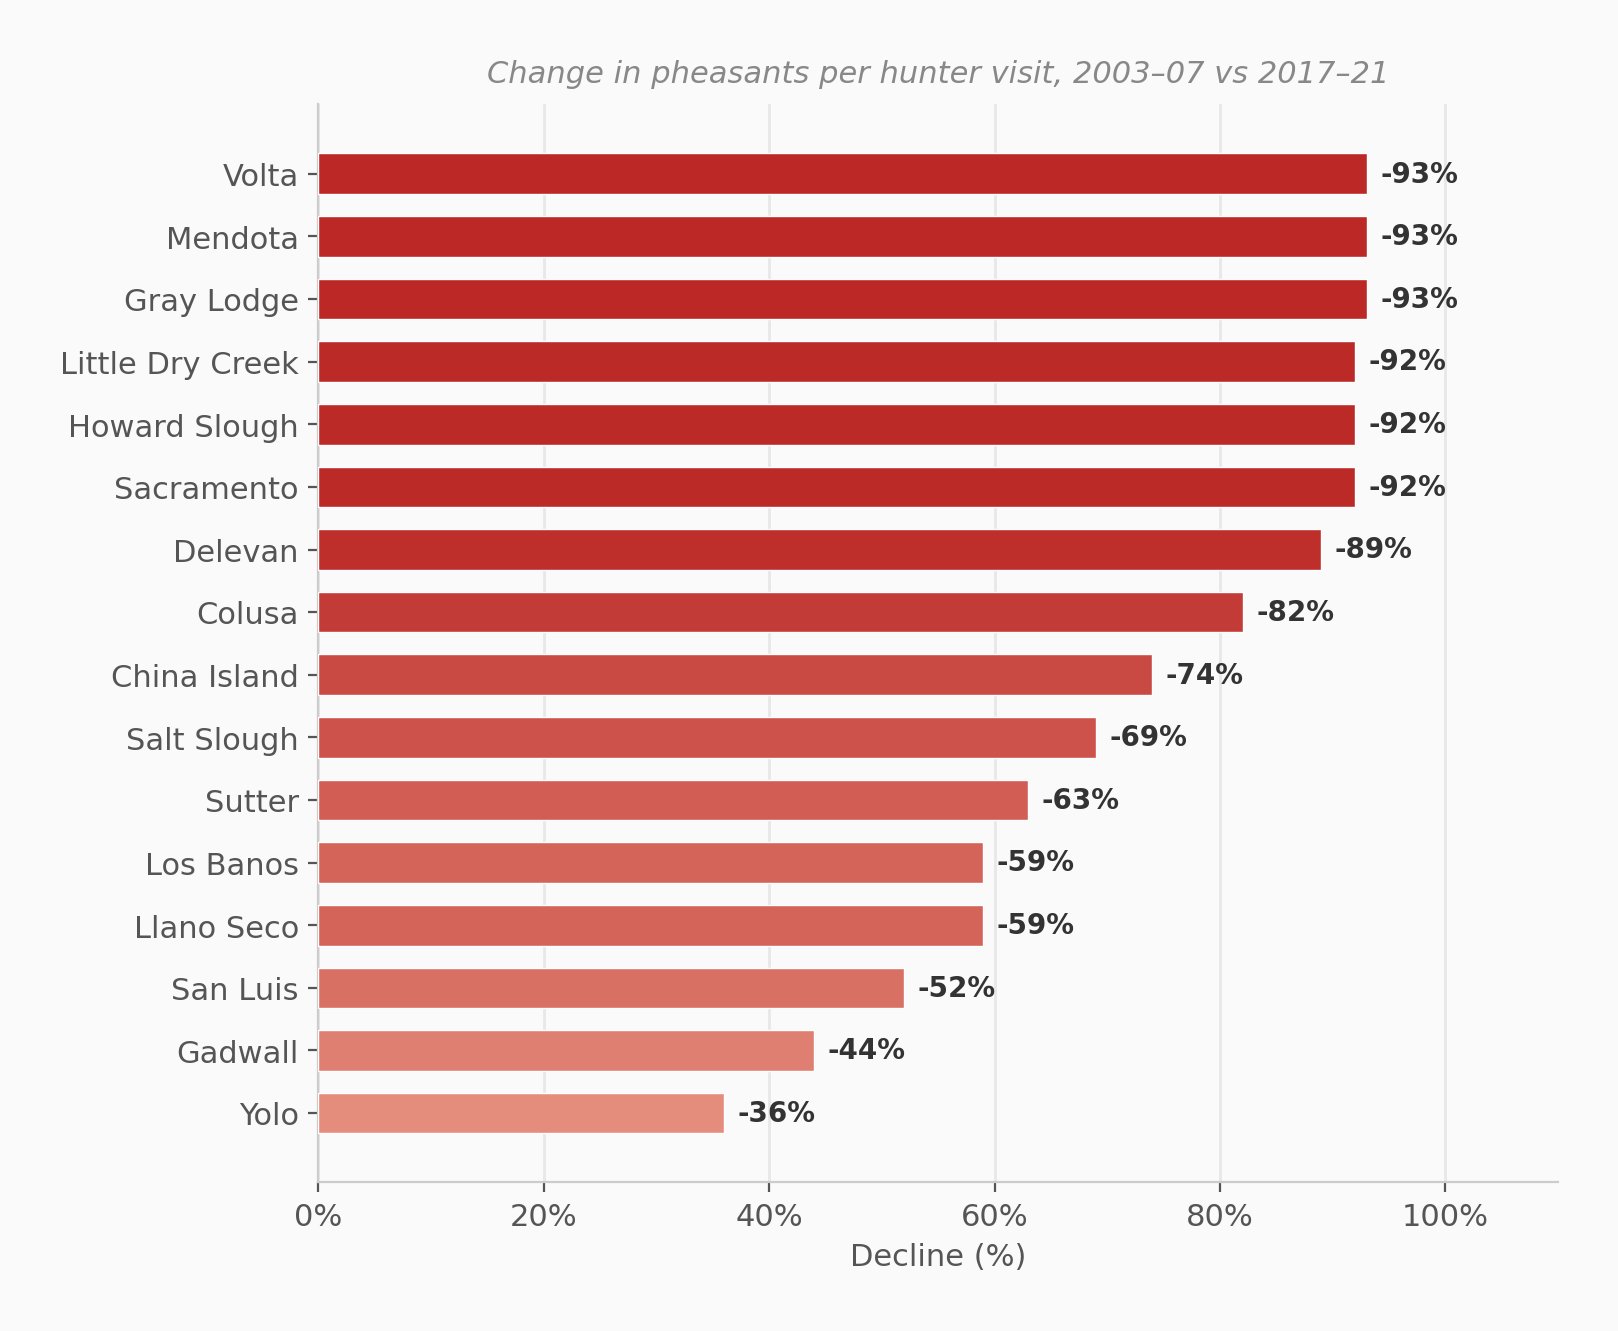
Volta, Mendota, and Gray Lodge all lost 93% of their per-hunter rate — meaning a hunter today finds one-fifteenth the pheasants they would have found 15 years ago. Even Yolo, the strongest refuge, saw its per-hunter rate drop 36%.
| Area | 2003–07 Rate | 2017–21 Rate | Decline |
|---|---|---|---|
| China Island | 0.475 | 0.124 | 74% |
| Little Dry Creek | 0.168 | 0.013 | 92% |
| Howard Slough | 0.165 | 0.013 | 92% |
| Gray Lodge | 0.113 | 0.008 | 93% |
| Salt Slough | 0.106 | 0.033 | 69% |
| Yolo | 0.094 | 0.061 | 36% |
| Llano Seco | 0.081 | 0.034 | 59% |
| Delevan | 0.057 | 0.006 | 89% |
| Colusa | 0.056 | 0.010 | 82% |
| Sacramento | 0.053 | 0.004 | 92% |
| Mendota | 0.038 | 0.003 | 93% |
| Los Banos | 0.035 | 0.014 | 59% |
| Volta | 0.023 | 0.002 | 93% |
| San Luis | 0.023 | 0.011 | 52% |
| Gadwall | 0.019 | 0.011 | 44% |
| Sutter | 0.014 | 0.005 | 63% |
China Island had the highest per-hunter rate in the early period (0.475) — nearly five times the next best area. Even after a 74% decline, it still leads at 0.124. If you're chasing efficiency, China Island and Yolo are the only areas with per-hunter rates above 0.05.
The Yolo exception — explained
Yolo is the one area that appears to have grown, with a raw harvest increase of +401% between the late 1990s and recent years. But that number is misleading.
Yolo Bypass Wildlife Area opened in 1997. President Clinton dedicated it in November of that year. In its first partial season, hunters took 19 pheasants. By 2001, the area expanded from 3,700 to over 16,000 acres with the acquisition of the Tule Ranch property. Harvest peaked at 624 birds in 2003 as the new habitat matured.
The "+401% growth" is comparing against a near-zero baseline when the area had just opened.
Once Yolo is established, it follows the same pattern as everywhere else. More hunters discovered it — Nov–Dec traffic rose 61% — but each hunter found fewer birds:
| Yolo Metric | 2003–07 Avg | 2017–21 Avg | Change |
|---|---|---|---|
| Pheasant harvest | 248 | 258 | +4% |
| Nov–Dec hunter visits | 2,645 | 4,258 | +61% |
| Pheasants per hunter | 0.095 | 0.060 | -36% |
The harvest held flat because more hunters were going — but each one was bringing home fewer birds. Yolo isn't an exception to the decline. It just got a late start.
Takeaways
- The decline is structural, not cyclical. A 92% drop over 25 years with near-perfect exponential fit means this isn't a bad stretch — it's a long-term population collapse driven by habitat conversion in the Central Valley.
- Every area is affected. 15 of 16 wildlife areas declined. The lone "grower" (Yolo) only looks like an exception because it opened during the study period.
- Per-hunter success confirms it. Even controlling for hunter traffic, the harvest rate dropped 77%. The birds aren't there.
- If you're going pheasant hunting, go to Yolo or China Island. Yolo produced more pheasants in 2017–2021 than the next five areas combined. China Island has the highest per-hunter rate. But temper expectations — both are declining.
- The half-life is 8 years. At the current rate, the statewide harvest will halve again by ~2029. Without habitat intervention, refuge pheasant hunting in California is approaching functional extinction.
Source: CDFW Ring-necked Pheasant Harvest Summary (DocumentID 105633). 416 area-year records across 16 wildlife areas in Sacramento Valley and San Joaquin Valley, 1996–2021 seasons. Per-hunter analysis uses CDFW waterfowl check-station data (Nov–Dec only) as a proxy for hunter traffic — these are waterfowl hunters, not pheasant-specific, but overlap with pheasant season at dual-use refuges.